Uncategorized

How To Choose The Best Mehndi (Henna) Design? (Python Code Included)

I know, having a sister, that a day before Eid is a tough day for girls around the world. There are a lot of decisions and preparations that go into this 3 day period of festivities. One little dilemma, that my sister has always had is choosing between the aesthetically most appealing mehndi design. As it is ‘chaand raat’ or the night the moon of eid is sighted, I thought I might do a fast blog post on how to automate this decision and make life of sisters around the world, a little easier. But to do this we, first, have to go back in time.

henna-design-for-beginners-step-by-step

In these progressive designs, it is apparent which ones are more aesthetically appealing, however, in more intricate designs it become progressively harder to know which design will be statistically more appealing to large number of people. 

A little Step Back in Time

In early 20th century, there began a discovery of mathematical graphs that were continuous everywhere but nowhere differentiable (fancy way of saying that the are not smooth). Lack of smoothness of such graphs rendered them useless to the mathematics of that time. Some specialists such as Poincare (the guy who discovered Einstein’s theory before him but got a tad bit late in reporting it) considered them useless; He argued that such graphs will have no use whatsoever, however, he argued, that they could be used to torture old school mathematicians.

Long story short, there have been number of mathematicians scratching their heads about these peculiar graphs until a dude named, Benoit Mandelbrot came in the scene. Mandelbrot was a maverick and would definitely be a rock star, had he not found his way spiraling in to Mathematics. He showed that such graphs/functions can be useful too; he called them fractals, which were derived from the word ‘Fractus’ in Latin, which means broken.

Fractals are geometrical structures that have fine scale, roughness and self-similar motifs which repeat as the fractal is further zoomed in or out. It is really crazy. You guys must check these out on internet. They are very intriguing. Fractals are of infinite length but contain a finite area (Trust me, I am not tripping). Following are some examples of these graphs.

The Koch Snowflake

Koch curve was introduced by Helge von Koch in 1904. To draw a Koch curve, start with drawing an equilateral triangle. Secondly, divide each line segment into three segments of equal length. Thirdly, draw an equilateral triangle that has the middle segment from step 2 as its base and which points outward. And finally, remove the line segment that is the base of the triangle from step 3. Keep repeating the process. The more the process is repeated,  the complex the figure gets.
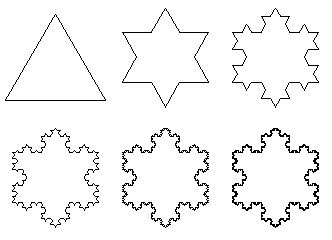
Picture11

Koch Curve

The Sierpinski’s Triangle

Sierpenski’s Triangle often called Sierpenski’s gasket, is constructed by following five simple steps. First, draw an equilateral triangle. Secondly, construct another triangle exactly in the centre of the first triangle, such that all vertices of this central triangle touch the mid-point of each side of the first triangle. Step two generates 3 triangles. And finally, repeat the step 2 using each smaller triangle as a template. Following figure is the evolution of Sierpenski’s triangle up to 5 iterates.

Picture10

Sierpenski’s Triangle

So now you have seen how these ‘cute’ mathematical motifs can be so devastating to mathematicians for centuries. Lets see how mathematicians finally tamed them. The changed the definition of a dimension. I promise I won’t go in the details here. I will just demonstrate how this new dimension is calculated. I am saving mathematics for a later, more detailed(and sadistic) post.

Calculating Fractal Dimension

Let’s assume you were given a task of calculating the true perimeter of British Isles. And with all enthusiasm you set out to complete your task.

Picture1

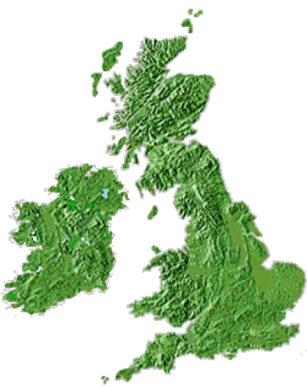
Setting out to calculate the perimeter; Which surely looks complicated.

You bought a new set of rulers. However, you soon realized that the perimeter of isles depends on the size of your rulers. The larger the size of your rulers, the smaller, is the perimeter of the Isles you can measure!

In fact, if you gradually decrease the size of the rulers or boxes in a grid, you notice that the measure of perimeter increase exponentially.

If we take the log of the box size and box count you can have a nice linear increase in the box size vs number of boxes in the grid.

Picture8

If you plot it, it looks nice and crisp line.

Picture9

Slope of this line is Fractal Dimension

Our new dimension, is a slope of this line. Slope is exactly calculated like you did in the school. That is by taking rise over run. In British isles’ case, the fractal dimension is 1.54. Intuitively, we can say that British isles are more complicated than a line which has a dimension and less complicated than a plane which has a dimension 2. Or more pretty than a line and less pretty than a 2D plane. From now on, we are going to call it, ‘fractal dimension’.

Following is how you can calculate the dimension in python.

import numpy as np
import scipy.misc
import scipy.stats as stats
import os, os.path

def rgb2gray(rgb):
    #converting images into gray scale for now as it is the standard. But we can play around with other filters too.
    r, g, b = rgb[:,:,0], rgb[:,:,1], rgb[:,:,2]
    gray = 0.2989 * r + 0.5870 * g + 0.1140 * b
    return gray

def fractal_dimension(Z, threshold=50):
    # Threshold defines the final pattern of image. We cna play around with it. We can choose different values to see how pattern changes wrt Fractal dimensions.
    assert(len(Z.shape) == 2)

    # This caluclates Minkowski–Bouligand dimension, which is commonly known as Box-counting dimension.
    def boxcount(Z, k):
        S = np.add.reduceat(
            np.add.reduceat(Z, np.arange(0, Z.shape[0], k), axis=0),
                               np.arange(0, Z.shape[1], k), axis=1)

        # We count non-empty (0) and non-full boxes (k*k)
        return len(np.where((S > 0) & (S < k*k))[0])

    # Transform Z into a binary array
    Z = (Z <span id="mce_SELREST_start" style="overflow:hidden;line-height:0;"></span>&lt; threshold)

    # Minimal dimension of image
    p = min(Z.shape)

    # Greatest power of 2 less than or equal to p
    n = 2**np.floor(np.log(p)/np.log(2))

    # Extract the exponent
    n = int(np.log(n)/np.log(2))

    # Build successive box sizes (from 2**n down to 2**1)
    sizes = 2**np.arange(n, 1, -1)

    # Actual box counting with decreasing size
    counts = []
    for size in sizes:
        counts.append(boxcount(Z, size))

    # Fit the successive log(sizes) with log (counts)
    coeffs = np.polyfit(np.log(sizes), np.log(counts), 1)
    return -coeffs[0]

But wait! Didn't I promise you that the post is about automatically finding more aesthetic mehndi designs?

Actually, to find the most beautiful mehndi design, all you have to do is to take the image of the design and calculate the fractal dimension of it using this code.

Number of research articles have reported that the design with highest fractal dimension is the one that is most beautiful! In fact, our history of art is is rich with fractals.

Aesthetics of Fractals

Geometry has always played a key role in arts. It was Euclidean(ordinary school geometry) geometry that brought about revolution in western arts by providing artists the way of drawing 3 dimensional objects on two dimensional plane of paper or canvas. Although it appears to be natural to us now, it was not the case before the renaissance period in arts. As the formalism of Euclidean geometry preceded its application in arts, this is not quite the case with fractal geometry. Fractal images exist in arts since prehistoric times and the formalism of fractal geometry was not complete until recently. Even the first deterministic fractal that Mandelbrot plotted was in late 1970s using computers. Generating fractals, other than simple curves mentioned above, was impossible before the advent of computers.

It can be postulated that fractals came in to arts through observing such phenomena in nature as nature is full of fractal like objects, which behave like deterministic fractals. The mystery that was associated with the art in fractal is that the fractal nature is clearly depicted in the ancient art. Secondly, the art from ancient times has evolved from fractals having lower dimensions to that of fractals having higher dimensions.

An American physicist Clint Sprott has demonstrated in 1993 that fractal dimension is clearly linked with aesthetics. That is the greater the dimension of a fractal the more aesthetically pleasing it is to us. And B. Sephar and Collin Clifford et al. further showed that this relationship doesn’t only hold with naturally occurring fractal objects, but exists in images irrespective of the method used to make them. That is either natural, human hand or mathematical iteration produces them. Thus a fractal appears to be more and more aesthetically pleasing to us the more complex it is. Why this relationship holds is still a mystery. Following are interesting examples of fractal occurrences in arts, even before they were defined properly by B. Mandelbrot.

Picture12

Benoit Mandelbrot with Koch Curve in the background. You can also see the definition of fractal dimension expressed as ratio of logs of box size vs count.

Will AI Replace Radiologists?

artificial-intelligence-698122_960_720

Ever since Geoffrey Hinton, who is considered the father of deep learning, said in a conference of radiologists that the field will soon be taken over by AI(Artificial Intelligence), a huge debate has erupted among radiologists and AI experts, whether this is a possibility in the foreseeable future or not.
If we look closely, the answer is clearly; No. Radiologists will not be replaced by AI systems. However, the nature of the job of radiologists will change.
The reason why there is confusion in the first place is that radiology(majorly) is a branch of medicine. And medicine is largely misunderstood beyond the practitioners of this field. Furthermore, there are very few people in the world who have a good knowledge of both AI and medicine and also statistical inference associated with it.
In classical texts, medical diagnosis is always described as a protocol where a set of procedures are followed. Firstly, a patient presents with a history. The doctor has few diagnoses in mind, based on it. The doctor then carries out physical examination, ruling out some of the diagnoses from the list of differential diagnoses he first had in mind. He further orders diagnostic tests which may include radiological tests to further rule out or confirm the definitive diagnosis. This procedure doesn’t highlight the cognitive or more explicitly, the inferential foundations of medical diagnosis. To generally define it, diagnosis is actually classification on a finite set of classes. These classes are disease states. Unlike Machine learning, clinicians have classically not only used statistical relations between features(eg. signs and symptoms) but also knowledge of the physics of normal and abnormal states (physiology and pathology, respectively) to arrive at a diagnosis or more aptly to classify a patient as to belonging to a given diseased state(s).
Suppose a 60 year old male patient comes to the doctor’s office complaining of fatigue, shortness of breath when he walks a few steps and cough. A doctor will not look at what probability the above symptoms appear together in a patient of heart failure or pulmonary hypertension. The doctor will right away try to incorporate these symptoms in the pathophysiology(physics of the diseased state) of few diseased states and then actively seek evidence that will enable him to finally classify the patient into one or more of the diseased states. He/she will subconsciously, follow the same process of incorporation, every few steps of the diagnostic protocol. Radiological evidence also adds up to this process and the major role of the radiologist is to help the clinician in subjectively viewing the evidence in context of the disease model in question. We will see how this subjectivity is important for classification here, but first let us take a look at how an AI system will try to classify a similar problem.
AI is a blanket term for number of algorithms but if we generalize it, it boils down to a procedure of weighting variables and transforming them from the dataset which will facilitate the correct outcome. In deep learning for example, the transformation of variables in a variable space(feature space) depends on the architecture of the network and weights are adjusted according to the penalty(cost) if the deep neural network makes a mistake in identifying the correct outcome(derivative of the cost function). So if enough data and its outcomes are fed into this AI system, the system will eventually ‘learn’ to transform variables and weighting them in a way that they can ‘compute’ the correct outcome if an unknown data point is fed into it with the same variables. For example, if images of a chest X-Ray from a patients with pneumonia are fed into a Neural Net where each individual pixel of an image serve as a variable (usually Convolutional neural nets are used for such a task, where variables are ‘patches’ of the image rather than individual pixels) and the weight on that variable and how it is mathematically transformed finally compute the outcome that it is a case of pneumonia or not, this type of general model(details excluding for brevity) can be used to perform any sort of classification, provided that a pattern exists and enough data is fed into the system.
A point that needs to be highlighted here is that neural nets, which are most applicable of the AI in this context, are analytical ‘black boxes’. Which means that mathematically we cannot know how data is being transformed inside its layers. Or simply put how data is being ‘used’. For example, we cannot know that on a given image of an X-ray of a pneumonia patient, neural net is confounding on ratios of chest wall to heart size, because these are different in children and children are more prone to pneumonia. This will make the result biased, yet this will not lower accuracy. However, if data changes where now we have more adults in the set and an outbreak of atypical pneumonia has occurred in adults, it might abruptly start giving false results.
The type of model based thinking(subjectivity) a clinician uses, reduces the amount of data needed to arrive at the definitive diagnosis. This is because once the clinician has arrived at a diagnosis he/she can simply look for sign and symptoms and lab findings that are bare minimum to diagnose the disease(diagnostic criteria) that are published by accredited medical institutions by research.
On the other hand an AI system will need data for every inference it makes. In the absence of a model, it may need to revise it’s data set to update the weights on any new set of population the data is being applied to. A radiologist, in contrast, uses a pathophysiological model to reason, to rule in and rule out many diseased states.
Also for testing a machine learning algorithm, data requirement is calculated based on the hoeffding bound. It is a loose bound that ensures that beyond a certain sample size, error will remain very low. Because it is loose, it needs a considerably large dataset to satisfy. And in most instances it is impossible to get a good, random, representative data to perform classification on and be confident that it is not biased.
Because of these issues and many such which might arise if we try to make AI systems as stand alone applications, we will always need a ‘supervisor’ who will understand, not only the disease process but also the one who could actually read and use evidence to come up with conclusions and incorporating those conclusion in expanding medical protocols and diagnostic criteria. We are going to need a radiologist who could establish the line of proof and clarify things in larger context. This means that the role of a radiologist will change. The radiologist of tomorrow will have to make sure that AI classifies, what it claims on classifying and understand it in and out so that he/she may use it properly. And also on maintaining subjectivity, so that a clinician can also use these inferences generated through AI algorithms.


“Statistics: A subject which most statisticians find difficult but in which nearly all physicians are expert.” ~ Stephen Senn

Isn’t it strange that a field of study that deals so crucially with pain and life should be based on such a loose foundations. Many other Natural Sciences, like Physics, Economics etc. have far more rigorous and consistent foundations and follow a system of proof than Medicine. Even stock exchange is better studied arena than Medicine. 

Of Mathematicians And Israeli Politics


Recently Stephen Hawking has decided to boycott a prestigious conference in Israel. So prestigious a conference that it is hosted by Israeli President Shimon Peres. This decision of a world renowned physicist and a lucasian professor of Mathematics has brought about ripples not only in politics but in the world of science, as well. Many are wondering why a physicist like Hawking would involve himself with such an issue like politics when he has secrets of universe to reveal. Some are furious that in contrast to scientific beliefs (that incubate and perpetuate freedom of all sorts) he unjustly targeted Israelis. The conference chairman has reported to have said.

 “The academic boycott against Israel is in our view outrageous and improper, certainly for someone for whom the spirit of liberty lies at the basis of his human and academic mission,”

In this post I would like to point out how in history two of the most famous mathematicians tried to dive in to the affairs of Israeli politics. They were Albert Einstein and Bertrand Russell.

Albert Einstein’s political activity started when he was first approached by a group of scientist and was urged to write a letter to then president of US, Roosevelt, asking him to build a nuclear bomb before Hitler could do it. After the World War II and the havoc those bombs caused, Einstein regretted this decision and later in 1952 when he was approached by Israel’s political lobby and was given the opportunity to become a president of Israel(he is the only citizen of US who has ever been offered to become a president of a foreign country). Einstein declined the offer with, what has now become, a very famous saying of his : “I am too naive for politics.”

Bertrand Russell, a mathematician and a philosopher would be most importantly remembered for his Principia Mathematica (a treatise on mathematical analysis). Russell was very active in 1950s and 60s for the cause of Nuclear disarmament. He even co-authored Russell-Einstein Manifesto that was signed by 11 of the most prominent mathematicians and physicists of that time.. likes of Max Bonr and Linus Pauling.

Manifesto can be accessed here: http://bit.ly/11V0hDv

Bertrand Russell was probably the first Mathematician who in 1970 just days before his death, condemmned Israel’s aggression in the Middle East. He even Called for an Israeli withdrawal to the pre-1967 borders.This was Russell’s final political statement and It was read out at the International Conference in Cairo after the day he died.

But whether it is appropriate for a Mathematician to delve into Politics without full knowledge of the political process and current affairs. The debate continues…..

source Guardian Science blog : http://bit.ly/10t63uL

A Documentary on Logic

http://bit.ly/18vh2uf

I just found out about this great documentary on logic. It has one of those rare qualities of being very well researched and edited!

It is a pity that most important tool to think, is never taught in schools. Only a handful of students going into philosophy and Mathematics will truly understand logic in its full graceful form. I would urge every one to watch it atleast once.

“The greatest m…

“The greatest minds, as they are capable of the highest excellence, are open likewise to the greatest aberrations; and those who travel very slowly may yet make far greater progress, provided they keep always to the straight road, than those who, while they run, forsake it.” ~ Rene Descartes

About 10 years or so from today, this sentence would change my life! 

Hello world!

Hello Everyone!! This is Ali !

My friends have always been suggesting that I start a blog. So voila I started it.

I have many interest and I have experienced many things in life and now I would like to write about them. The main reason I am starting this blog is to keep track of all my ideas and to have feedback on them from you guys.

Mostly, I would write about things that interest me most and they are : Mathematics, Medicine, Science in general, Future and Children. I hope you guys will like it.

Bon voyage !!

Ali